Build Any Report. Ask Any Question.
Three report designers, a Visual Query Builder, and 500 pre-wired endpoint data views. No Power BI. No SSRS. No Grafana. Everything built in.
Three Designers for Every Need
From executive dashboards to granular tabular reports to change intelligence — pick the right tool for the job
BI Dashboard Designer
WYSIWYG drag-and-drop canvas with ribbon toolbar. Layout metric cards, donut/bar/line charts, and grids. Bind to multiple data sources with the chart property editor. Export, import, and share dashboards.
Tabular Report Designer
Visual Query Builder with drag-and-drop table joins. Monaco SQL editor with syntax highlighting. Column picker with Expression, Sorting, Grouping, and Criteria. Validate SQL before saving.
Change Timeline Designer
Purpose-built for change intelligence. Four grouping modes (Device, Field, Source, Flat). Drift and Scatter chart modes. Bidirectional grid-chart sync. Track what changed across any data source over time.
WYSIWYG Dashboard Canvas
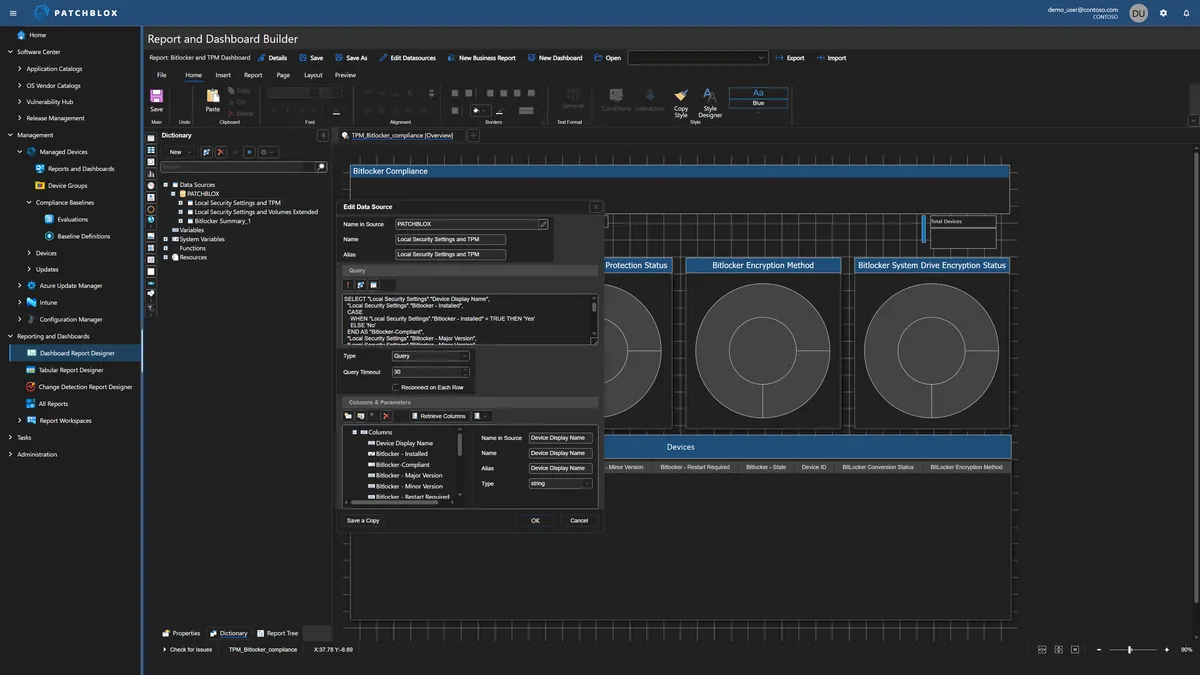
The BI Dashboard Designer gives you a full drag-and-drop design surface with a ribbon toolbar (File, Home, Insert, Report, Page, Layout, Preview). The Dictionary panel shows your data source tree. The Chart property editor lets you bind Values, Arguments, Series, and Indicators by dragging fields directly from the Dictionary.
Each dashboard can connect to multiple data sources, each with its own SQL query. The Data Source Selection dialog supports New, Edit, Delete, Validate, with a Query Builder button and raw SQL editor.
Visual Query Builder
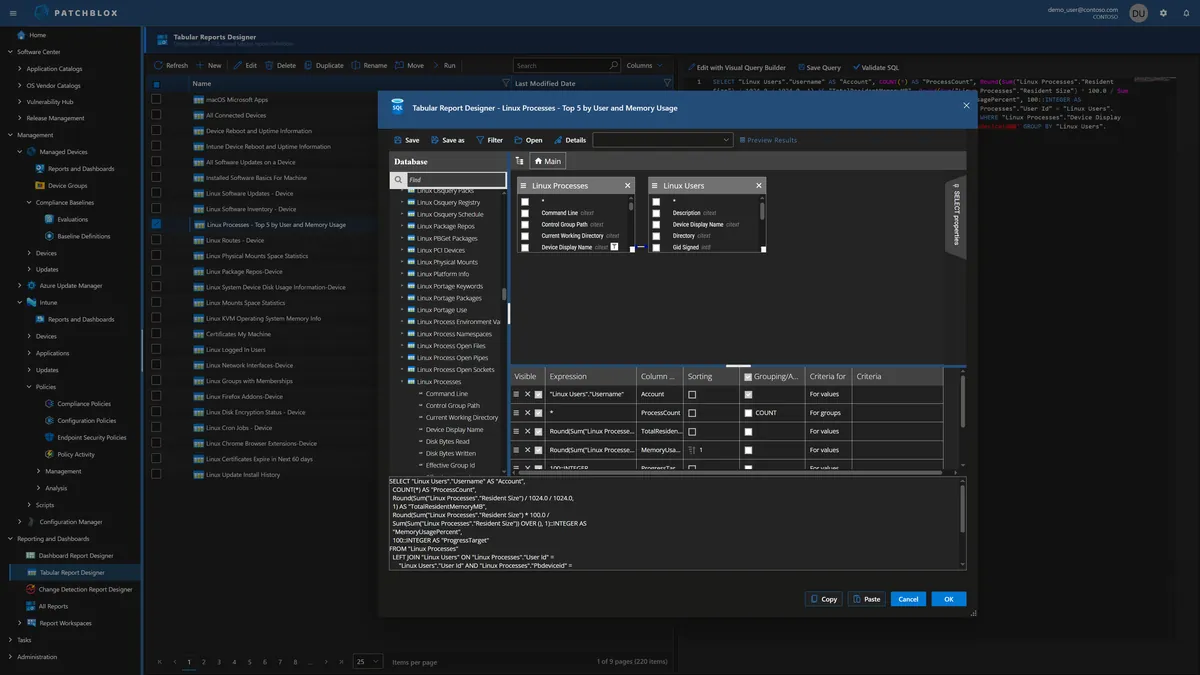
Don't write SQL? Don't need to. The Visual Query Builder shows all 500+ data views in a scrollable list. Click any view to see its columns. Drag tables onto the canvas to build JOINs visually. Select columns with the column picker — set Visible, Expression, Column Alias, Sorting, Grouping/Aggregation, and filter Criteria.
The generated SQL updates live at the bottom as you build. Copy it, paste it, or switch to the Monaco editor for hand-tuning. Validate SQL execution before saving.
Change Timeline Designer
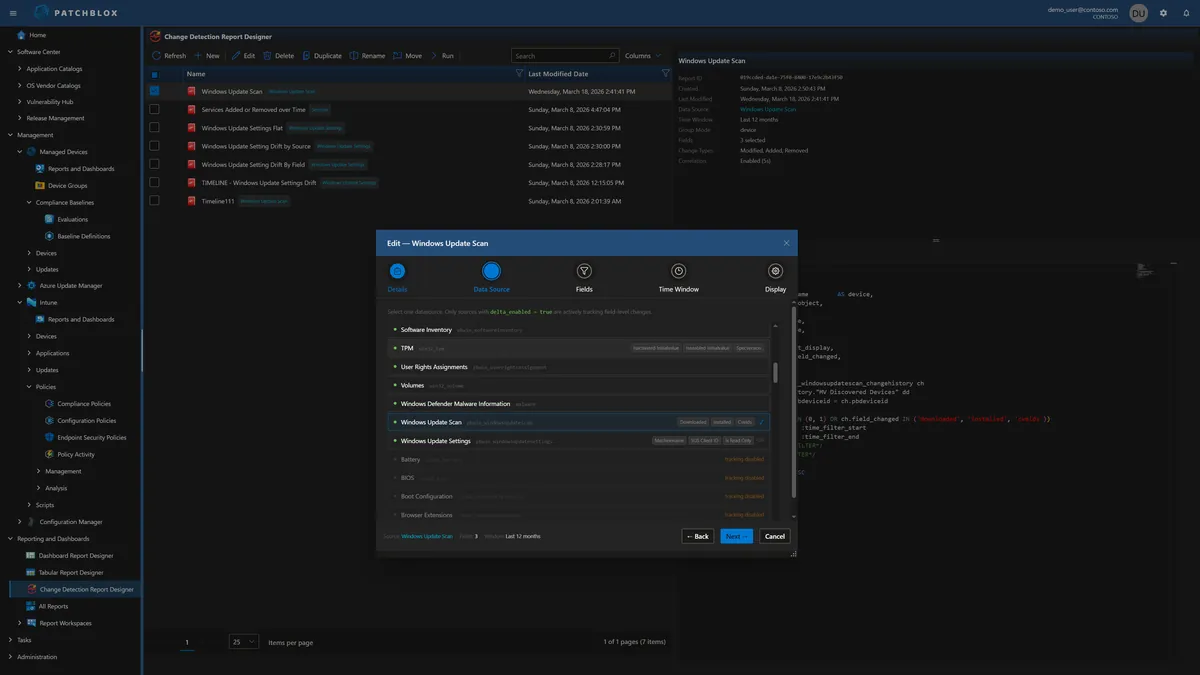
Purpose-built for change intelligence. Select from any delta-enabled data source — Windows Update Scan, Services, Software Inventory, Patchblox Package Catalog, TPM, and more. Choose which fields to track, set the time window, and configure grouping and display options.
Reports show changes grouped by Device, Field, Source, or Flat — with Added, Modified, and Removed badges, old/new value comparison, and change count per device. The Configuration Drift chart shows distinct devices affected per day as a SplineArea chart with field-level breakdown.
Change Timeline Reports
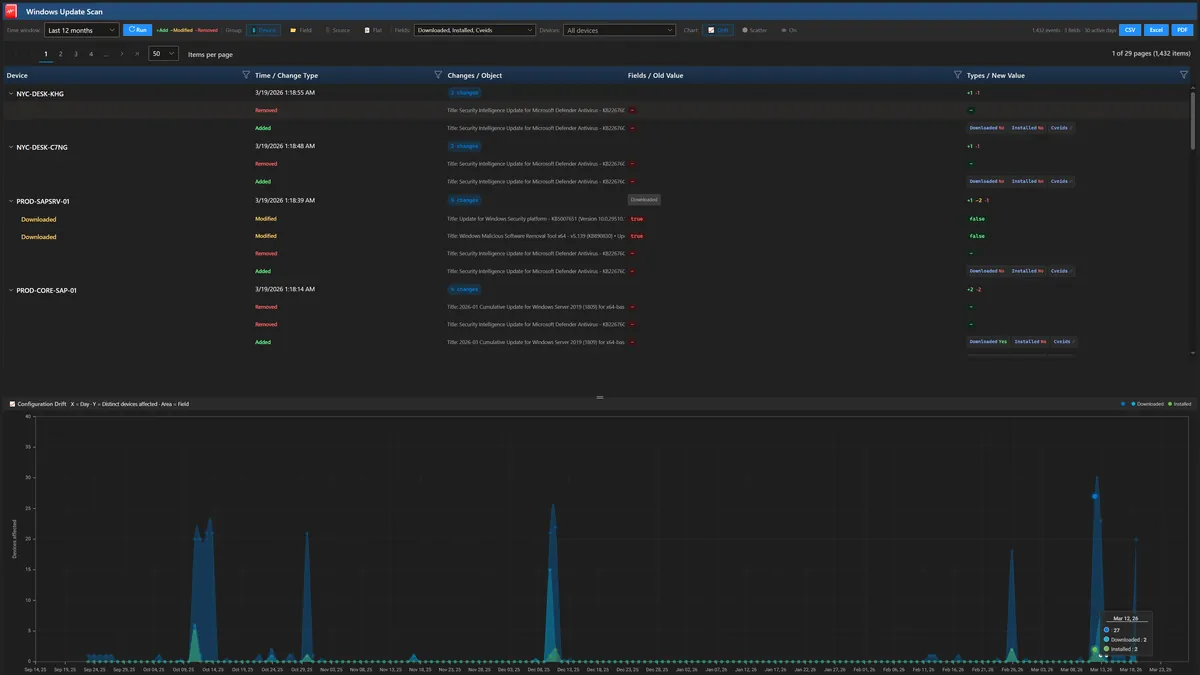
See exactly what changed, when, and on which devices. The report viewer shows 1,432 events across 30 active days for this Windows Update Scan — with per-device breakdown, change type badges (Added/Removed), field-level detail including Downloaded, Installed, and CVE IDs, and the drift chart showing spikes in change activity across your fleet.
Export to CSV, Excel, or PDF. Filter by device, toggle between Drift and Scatter chart modes, and click any chart point to jump to the corresponding grid rows.
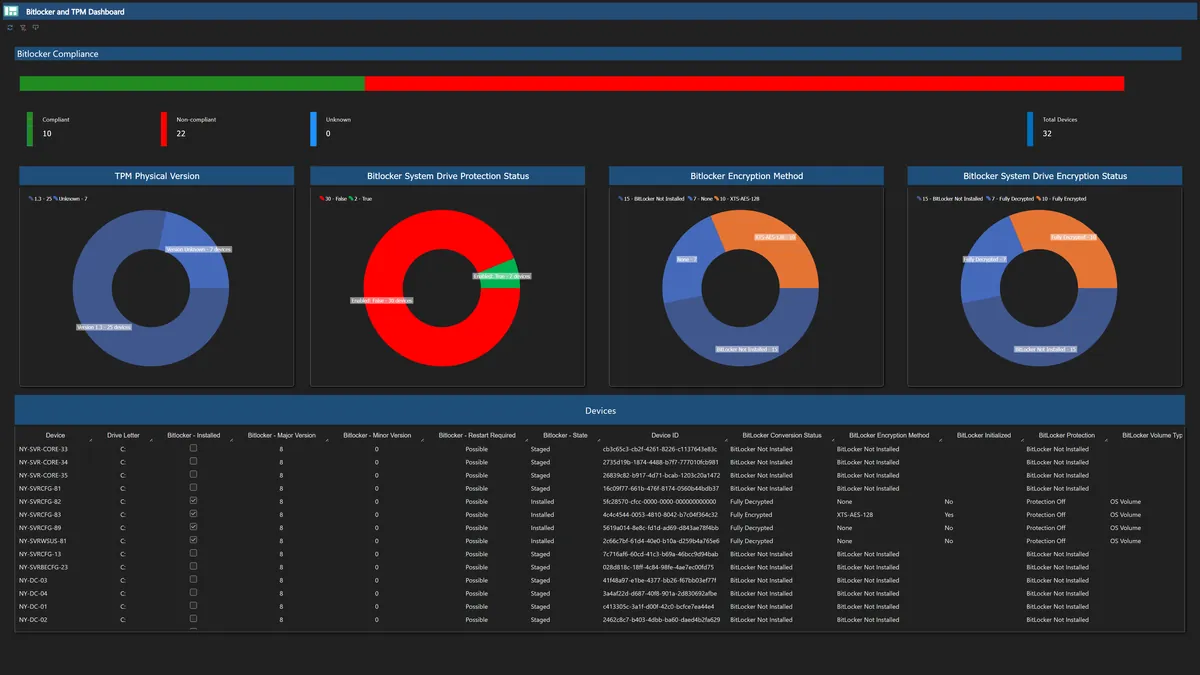
Production-Grade Dashboard Output
Dashboards built in the BI Designer render as fully interactive reports. This BitLocker & TPM compliance dashboard shows a compliance progress bar, four donut charts (TPM version, protection status, encryption method, encryption status), and a per-device detail grid — all driven by SQL queries against your live endpoint data.
Every panel in the Patchblox Resource Explorer is built using this same report engine. If we trust it for our own product, you can trust it for yours.
Build Reports That Answer Your Questions
500 data views, 3 designers, zero external dependencies